HemoRun
Our device, HemoRun, is an at-home hemoglobin test meant for athletes to be able to find out if they are iron deficient. My team consisted of Andrew Annulis, Shanna Fischzang, Bradley Sweeney, Chris Villavicencio, and myself. This project was done during our sophomore year Biomedical Product and Experimental Design class at Tulane University. Our device was intended to be minimally invasive and only require a very small amount of blood in order to get results quickly and wherever the user needs them. This project was done from August 2018- December 2018.

Final Prototype
Our final prototype consisted of a homemade spectrophotometer connected to an Arduino. Our homemade spectrophotometer was made using a standard LED as well as a photoresistor both input into a CAD-designed 3D printed housing. This housing has a slot between the LED and photoresistor where a cuvette containing the sample can be placed.
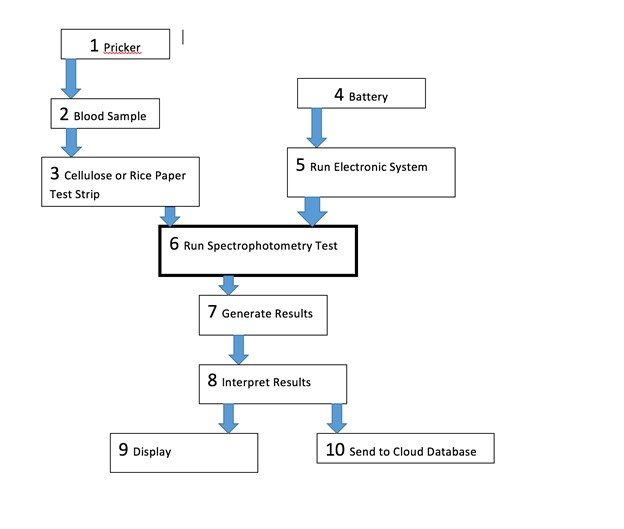
Design Flowchart
Our test consists of two parts: the sample and the electronic analysis of the sample. The sample requires the finger of the user to be pricked and a drop of blood to be placed on our transparent test strip. During our testing, we used a strip of cellulose paper as our transparent test strip. The absorbance of the sample is then obtained and calculated using a photoresistor and an Arduino. After this, the absorbance value would be converted into a concentration using calibration curves and the levels in the user’s body would then be displayed and sent to a cloud database.
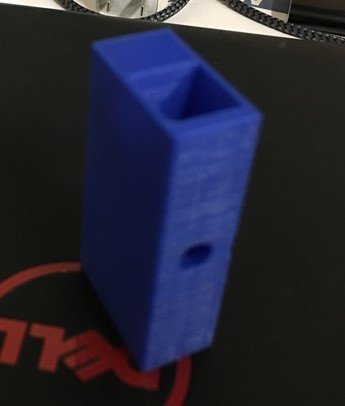
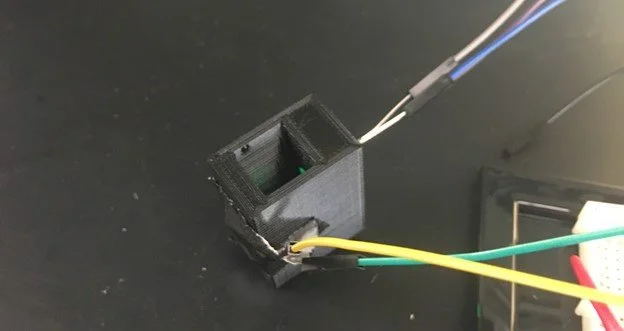
Our Device
The 3D printed housing for our device can be seen below. The square hole in the middle is where the cuvette containing our test strip with the sample would be placed. There is also a hole on either side of the cuvette, one for the LED and the other for the photoresistor. The picture on the right shows the photoresistor and LED attached to the housing.
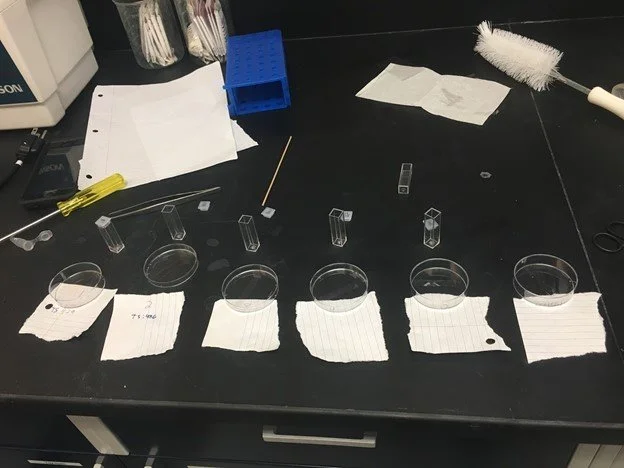
Testing
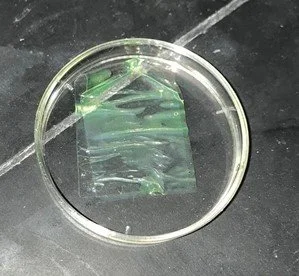
To test our device, we first created solutions with different concentrations of fluorescent dye. Next, we put a few drops of each of these solutions onto strips of cellulose paper and let them sit to be absorbed by the paper. After that, each strip with solutions of different concentrations was placed into a cuvette and the sample was tested with our homemade spectrophotometer to obtain the absorbance levels of each sample. We also ran tests using liquid concentrations that filled the cuvette rather than the test strips with a few drops to see if there was a significant difference in the readings. On the right, you can see a close-up of one of the cellulose strips absorbing one of our solutions of fluorescent dye. On the left, you can see the solutions of different concentrations being prepared side by side.
Testing Results
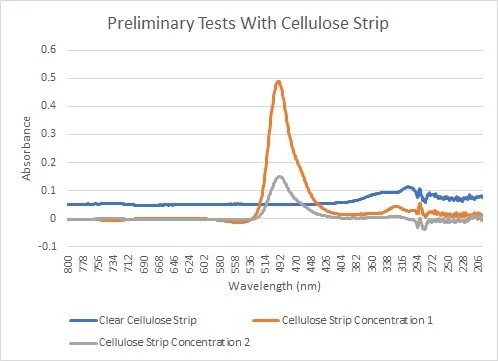
Here you can see the graph of the absorbance values for two samples with different concentrations. Concentration 2 had about half the concentration of fluorescent dye as concentration 1. You can see that we were able to identify that there was in fact a difference in concentration, but the shown difference was not the 50% we were looking for. The tests we ran with a cuvette of the liquid sample rather than a test strip yielded more accurate results. Because of that, we determined that in a future iteration we would need a transparent test strip that was more able to absorb the entirety of the sample in a consistent manner. Our initial testing proved that our homemade spectrophotometer worked but that we needed a test strip with more consistent absorbance to obtain accurate values.