A Wearable Device to Monitor Risk of Heatstroke
With climate change fueling a global rise in temperatures, the risk of heatstroke for people in areas with a hot climate will continue to rise for the foreseeable future. This was the motivation for my team members and me to create a wearable device able to monitor the risk of heatstroke. This device was mainly intended to be used by people doing manual labor or other types of physical exertion in hot areas. This project was done in 2019 at the University of Melbourne, in a Biosystems Design class. My team, consisting of Aryan Motevali, Darren Tan, and myself, utilized the available lab equipment along with Labworks software to work on our idea for the semester. At the time of this project, there was no available technology on the market that could solve the problem we identified. This project was done from August 2019- November 2019.
The Background
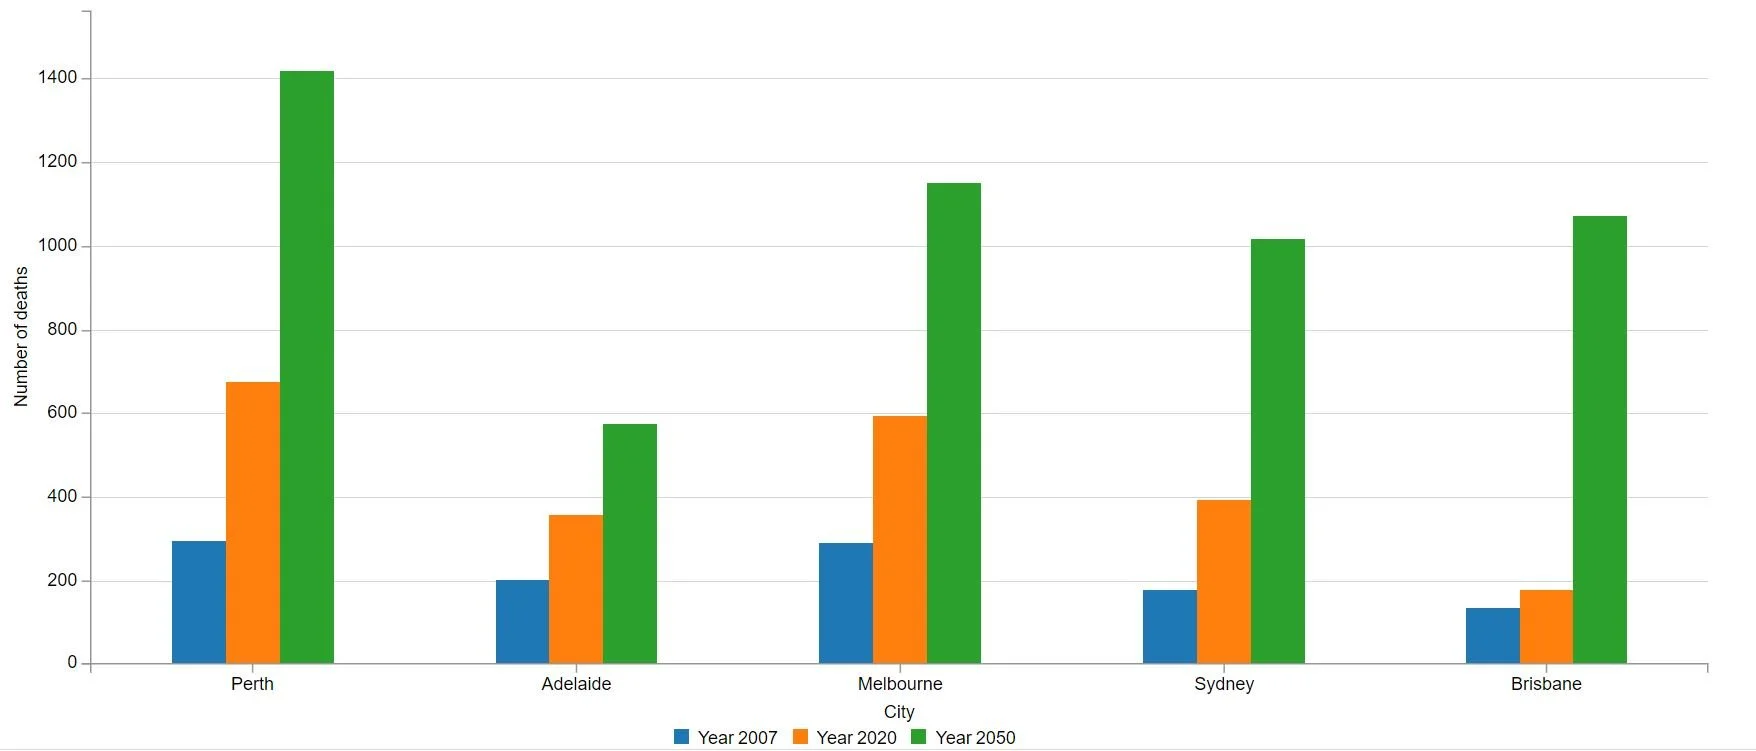
As I mentioned before, with global temperatures on the rise, the risk of heatstroke in hot areas will continue to go up as well. This chart shows predictions from the Australian government about the number of heat-related deaths that would take place in the coming years.
Australia State of the Environment. “Estimated Annual Average Number of Heat-Related Deaths, Selected Capital Cities and States, 2007, 2020, 2050.” Australia State of the Environment Report, Australia State
Our Idea- 4 Parts
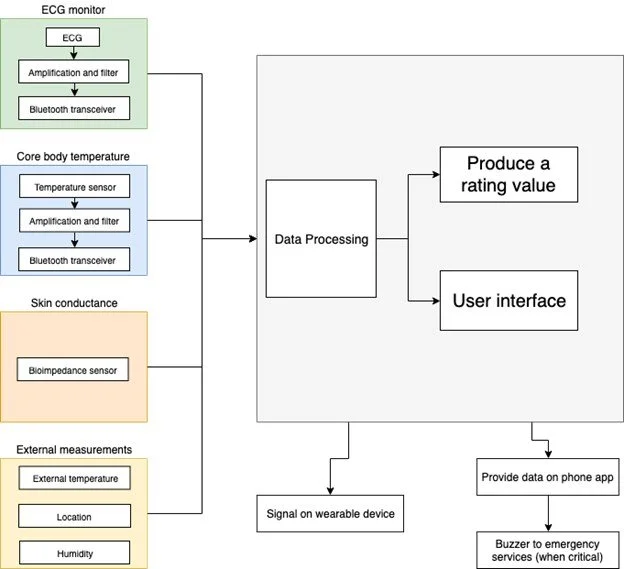
Our idea was to take into account multiple factors to determine an overall risk of heatstroke for the individual using our device. These four factors were internal body temperature, heart rate, skin conductance (related to hydration), and the ambient weather conditions in the area. These four factors would each have the associated risk of heatstroke calculated as a number between one and ten. For three of the four factors, when the risk level for any of them rises above seven, moving the risk from moderate to significant on our scale, the user will be notified and instructed to find a place to cool down and hydrate. The fourth factor, the weather conditions, will contribute to its own separate risk number due to the fact that the other three are all measured off the person themselves and will be very dependent on the weather. We were able to prototype inputs for three of these factors but, due to time and material constraints, we were unable to completely model an input mechanism for skin impedance.
ECG- Heart Rate Sensor
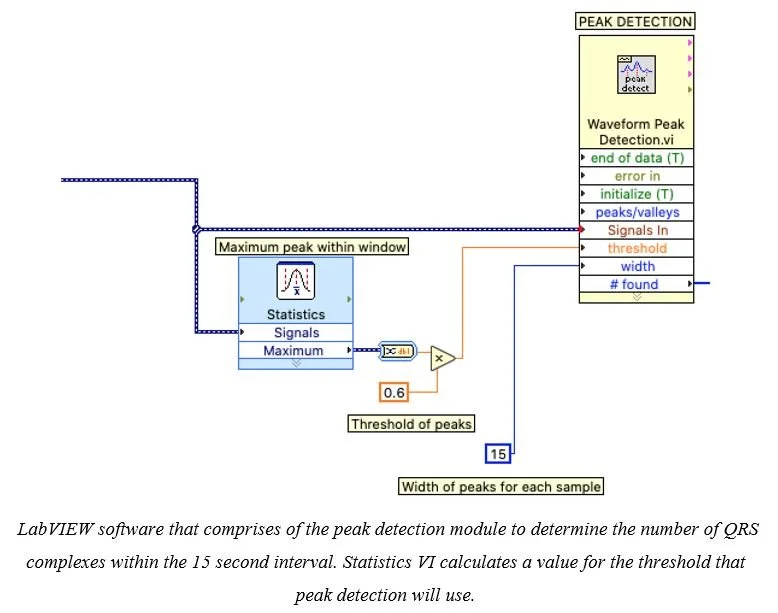
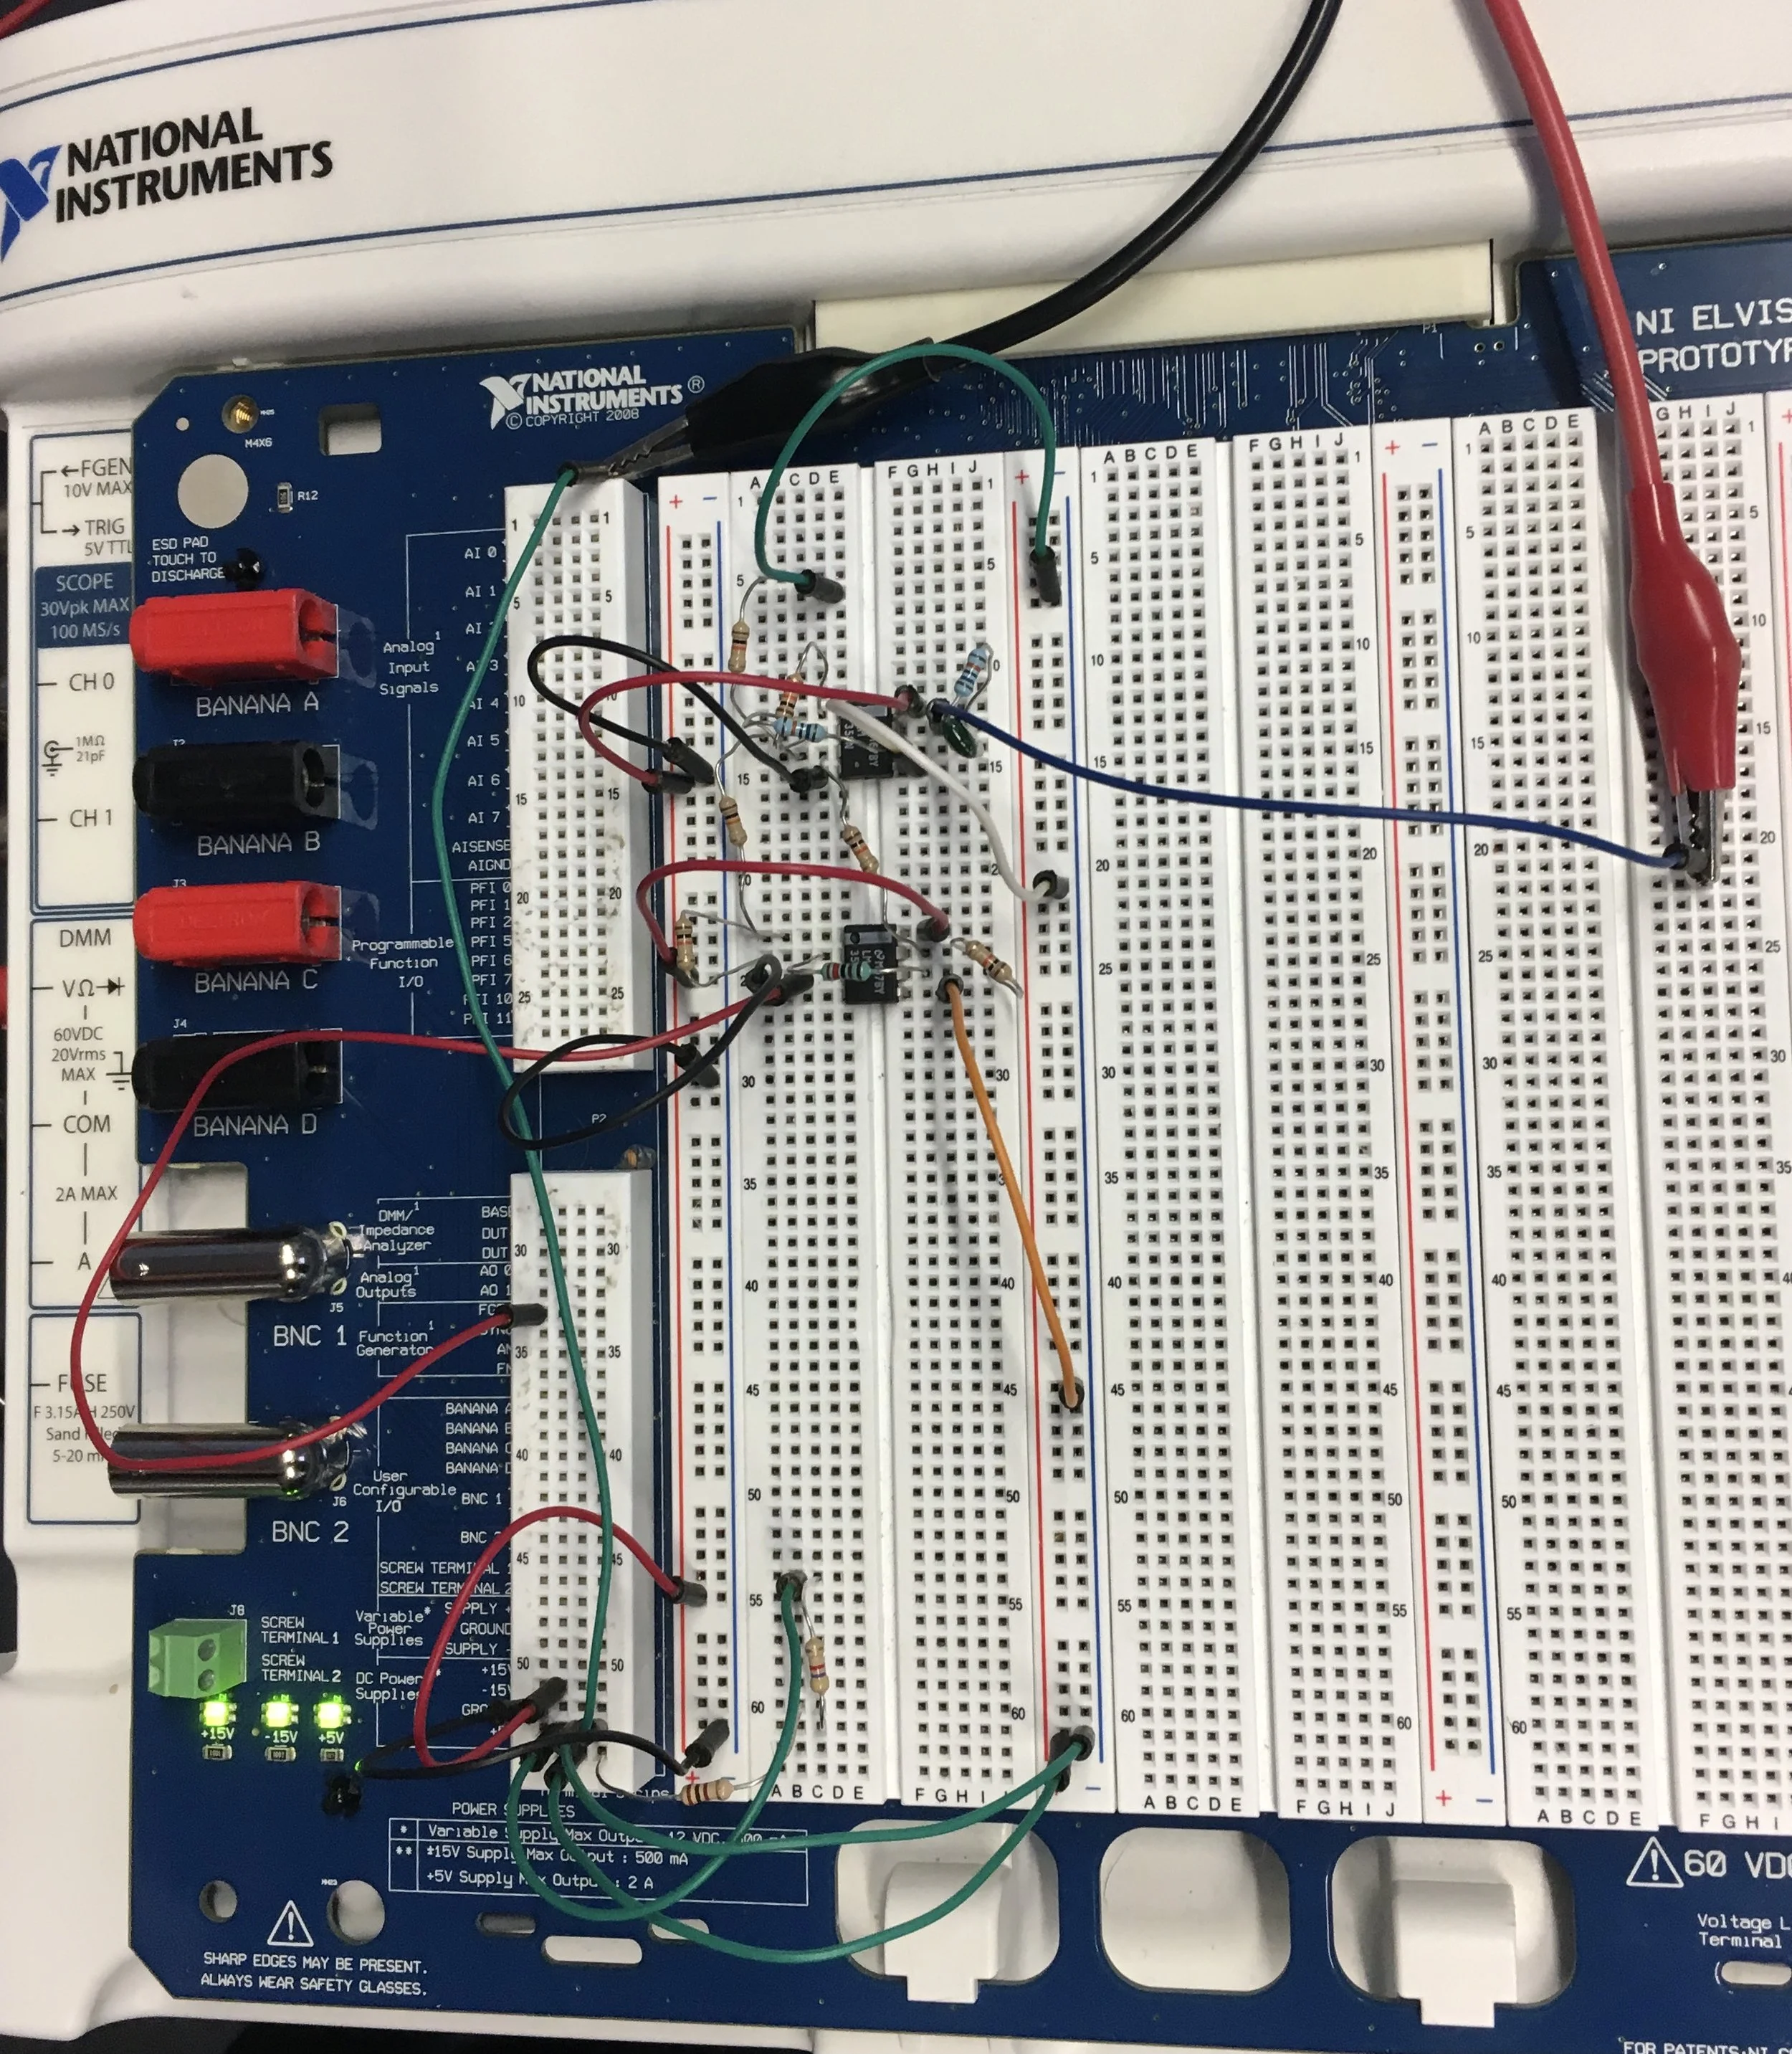
The heartrate sensor was one of the physical prototypes my group created. We created the circuit that can be seen below and physically tested our heartrate sensor on actual people to confirm its accuracy. Within the circuit, we used an amplifier as well as a band-pass and notch filter in order to clean up our ECG signal and turn it into an accurate heart rate measurement based on the number of QRS complexes. After some experimentation, we were able to gather accurate results and input them into our overall risk calculations using Labview software.
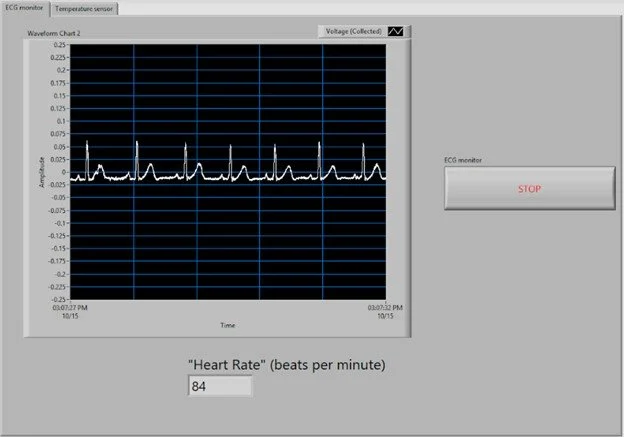
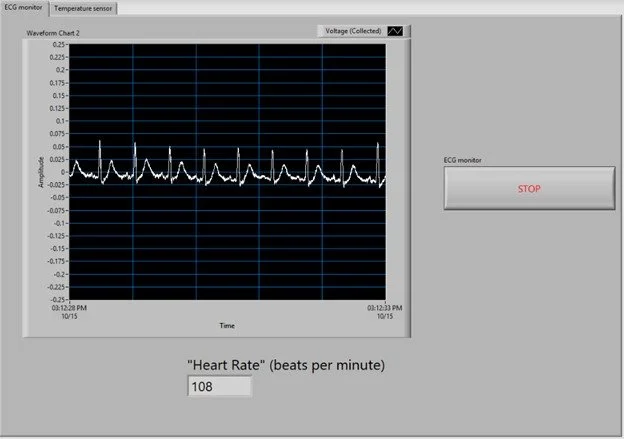
Above you can see in the bottom two images the graphs of the measured, amplified, and filtered ECG signal along with the corresponding calculated heart rate in beats per minute.
Body Temperature Sensor
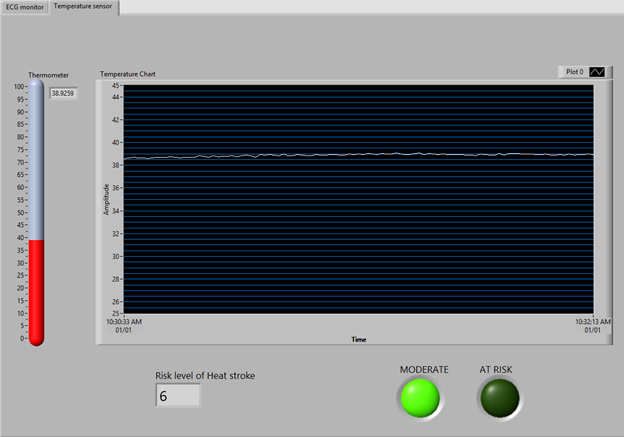
At the time of this project in 2019, measuring internal body temperature was not as easy or readily accessible as it is today. My team decided to use the temperature of the axilla (or armpit) to determine the internal body temperature of the user of our device. Obviously, the temperature of one’s axilla is not the exact same as the internal body temperature. After research, along with trial and error, we decided to use the equation seen below to relate the axilla temperature to internal body temperature. We were able to retrieve accurate internal body temperature results using this equation. In terms of how the temperature of the axilla was actually measured, we used a thermal resistor, or thermistor, which changes its resistance value in a circuit based on its temperature. We calculated the thermistor resistance versus a reference resistance to determine the axilla temperature and then the internal body temperature.
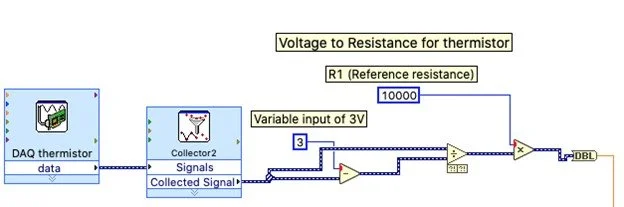
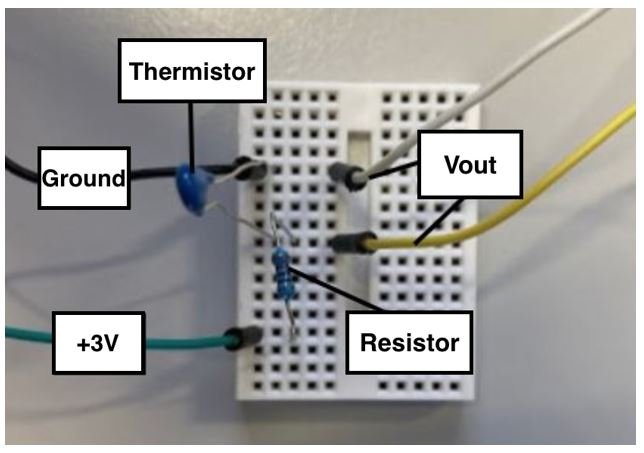
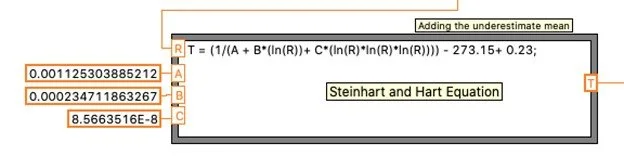
The bottom left image here shows the Labview software view of part of our conversion from measured voltage to thermistor resistance.
Weather Conditions
The final factor we were able to actually input into our prototype was the weather conditions. Obviously, this will be a big factor in determining the risk for heatstroke. However, the other factors we measure will be directly correlated to this factor as well so we decided to keep the weather risk number separate from the others. The three factors of the weather we chose to include in our first prototype were temperature, relative humidity, and wind speed. With these three factors, we calculate an apparent temperature or a “feels like” temperature using the Australian Apparent Temperature Equation. We use the apparent temperature to determine our separate heatstroke risk number which is more of an overall risk for everybody at that time rather than the specific user.
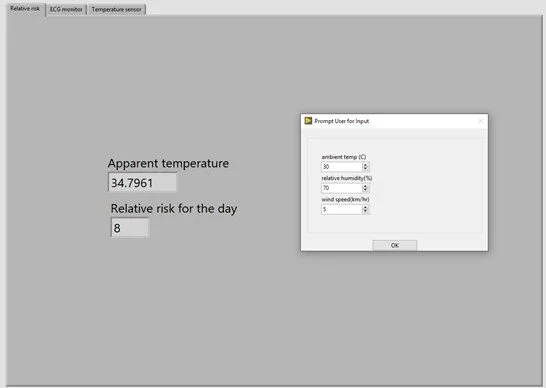
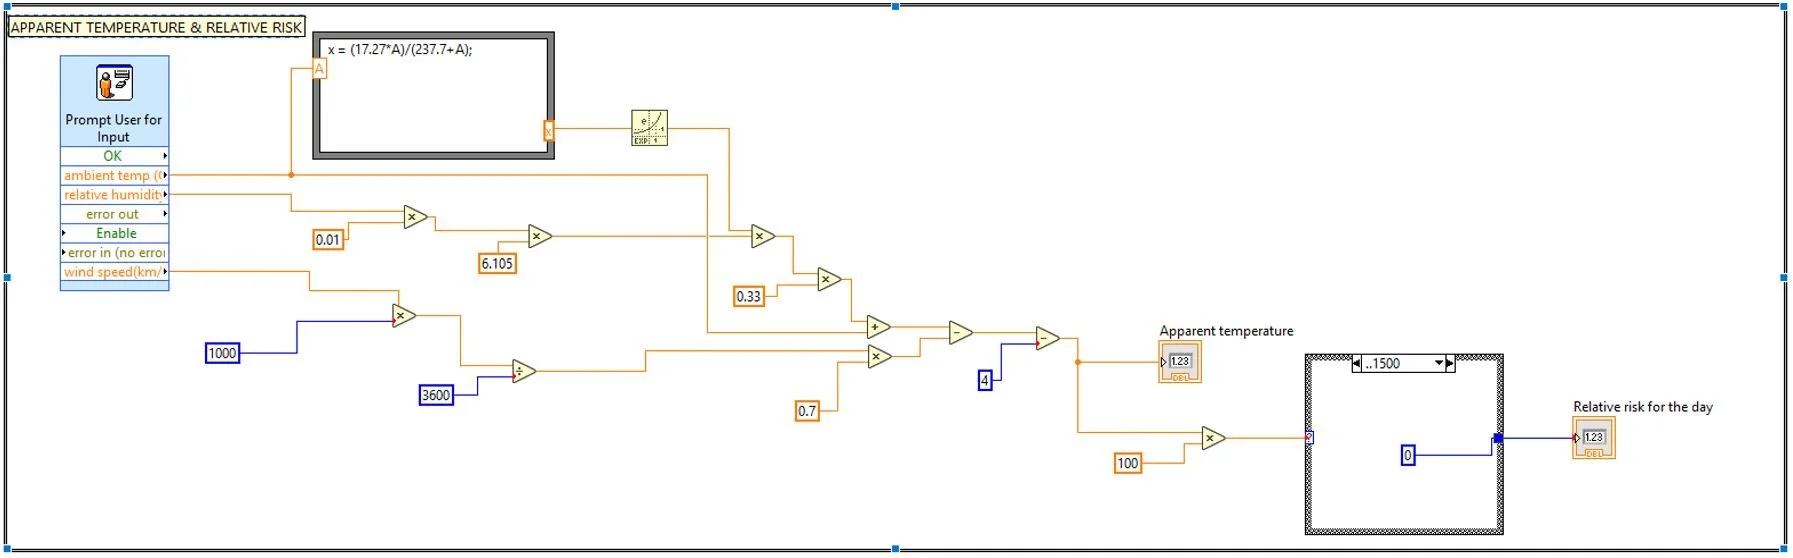
This is the Labview screen where we incorporated the Australian Apparent Temperature Equation